True story: There was a fleet carrier with two owners who disagreed on how to run their business. Eventually they went their separate ways, each taking half the fleet. Their new businesses — let’s call them Company A and Company B — still used the same trucks, the same owner-operator drivers, and traveled the same routes, but that is where the similarities ended.
Company A chose to truly prioritize safe driving protocols — enhancing safety, lowering premiums, and improving access to resource management and cost-effective maintenance. Company B did what they could to get by. This difference had a major impact on Company A’s ability to access the best insurance rates.
Company A’s secret? Using a powerful combination of analyzing Behavior Analysis and Safety Improvement Category (BASIC) scores from FMCSA, layered with telematics data and proactive driver coaching.
Visualize Issues and Challenges
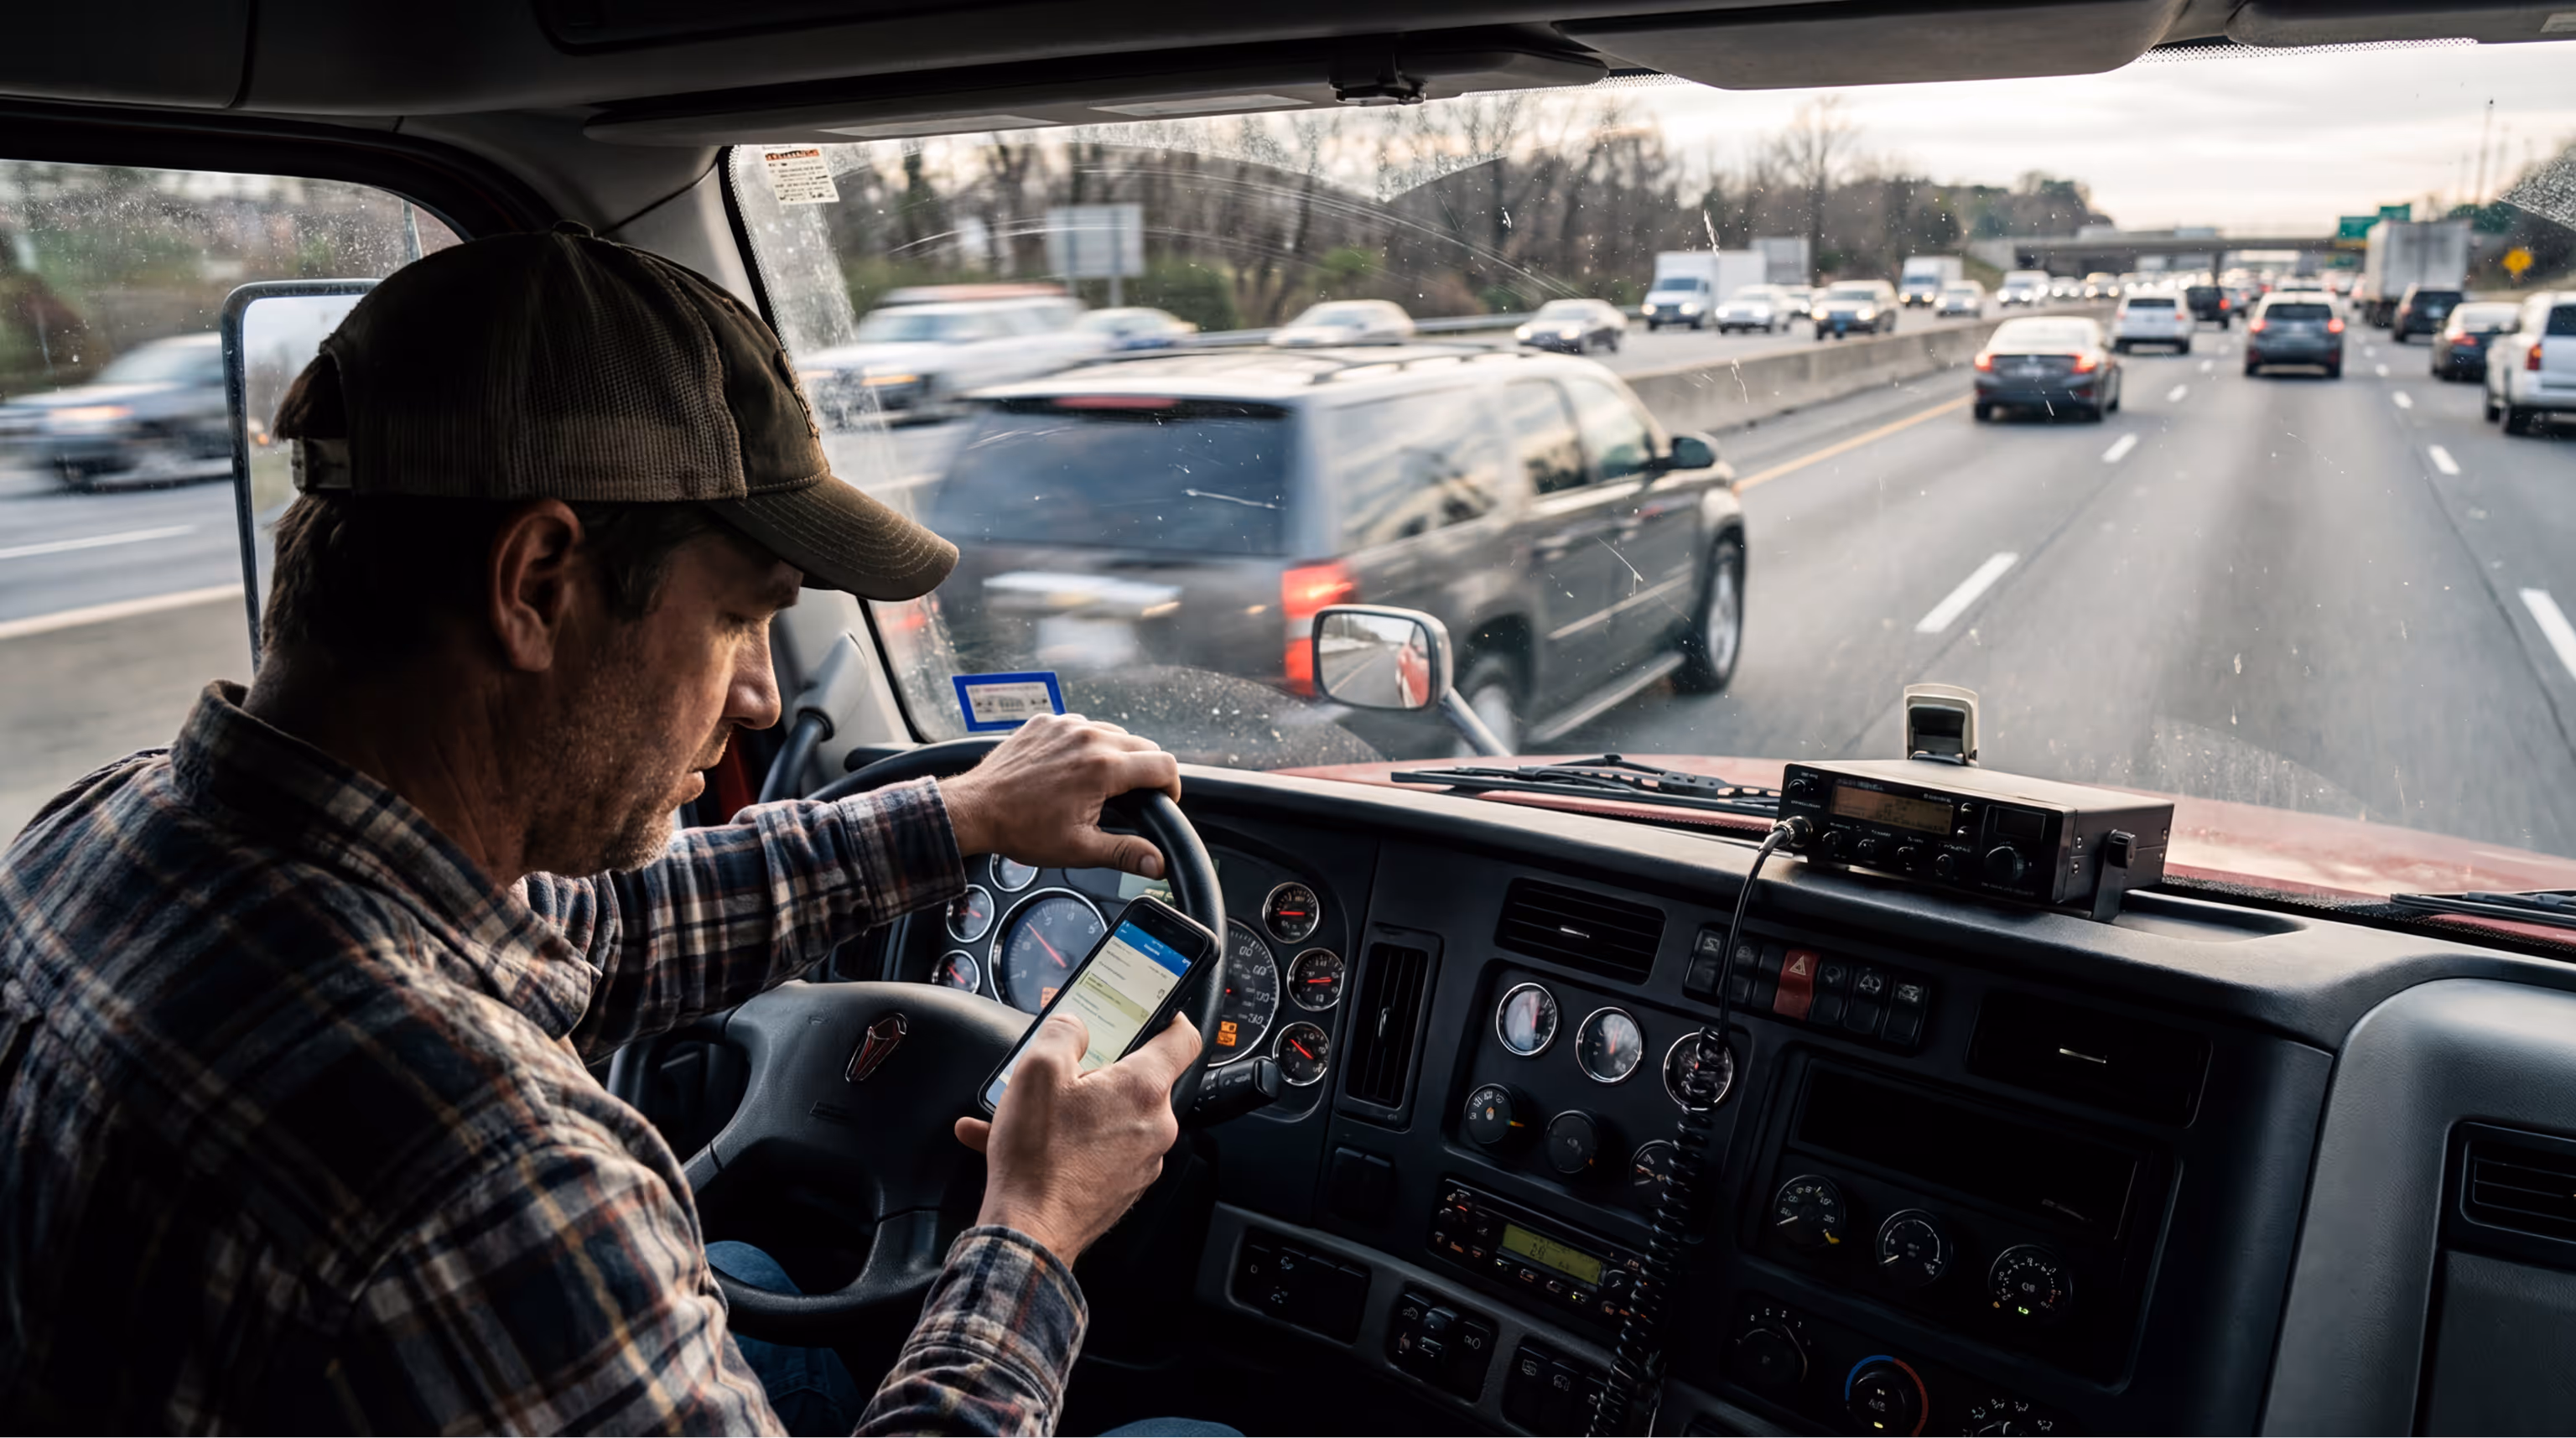
For vehicle fleets, telematics data can include truck location, driver behavior, and engine diagnostics.
For many years, carriers relied solely on BASIC scores, which evaluate seven components:
Driving safety
Crashes
Hours of service (HOS) compliance
Vehicle maintenance
Controlled substances/alcohol use
Hazardous materials compliance
Driver fitness
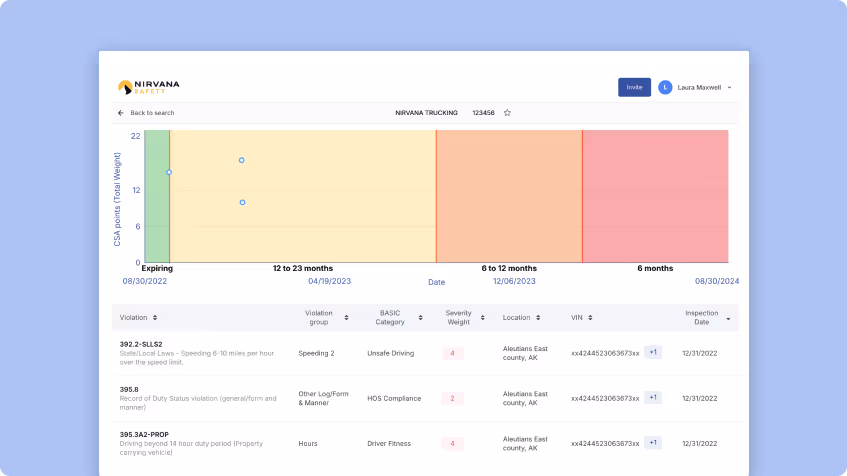
- Even if two companies have similar BASIC scores, telematics can tell a very different story. Using the Nirvana Safety Platform, here’s how things played out for Company A and Company B:
- Company A had a few BASIC scores above threshold, including “unsafe driving,” but telematics revealed those violations were not consistent fleet-wide behavior.
- Company B’s BASIC scores looked good on paper, but telematics showed frequent harsh braking, harsh turning, and speeding — behavior that simply hadn’t been caught yet.
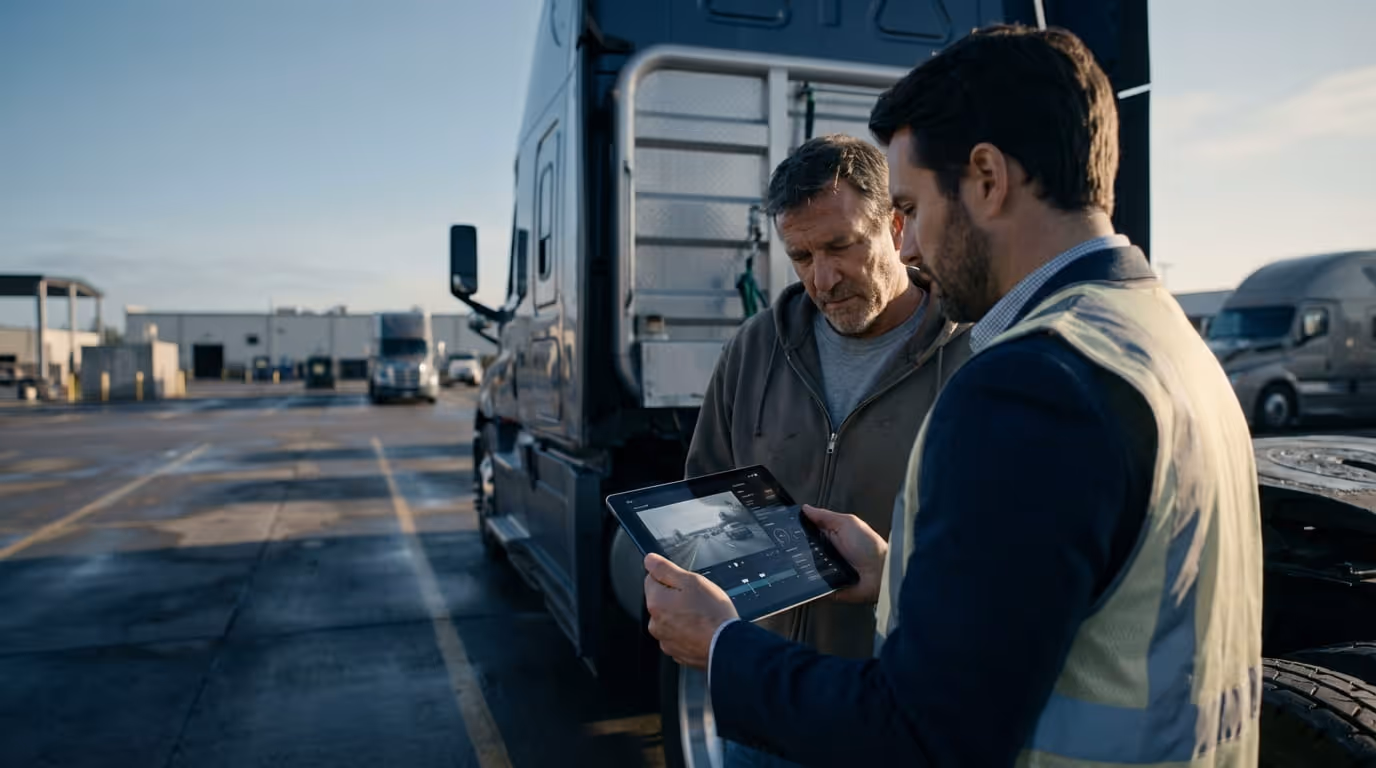
Information Analyzed
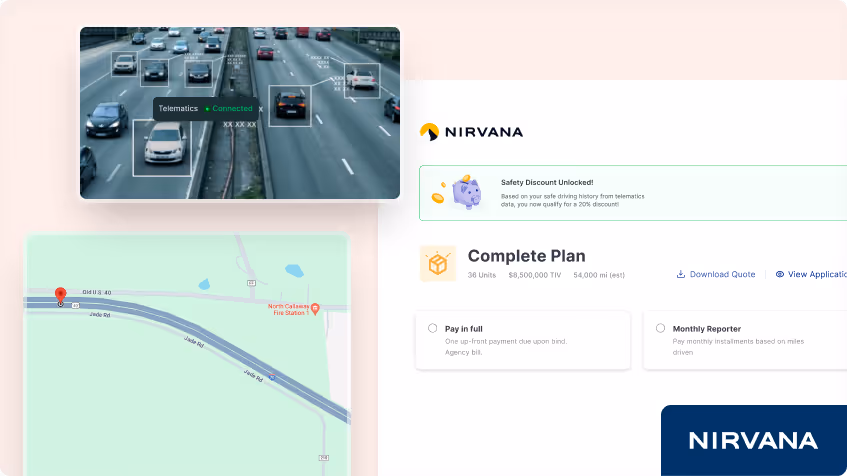
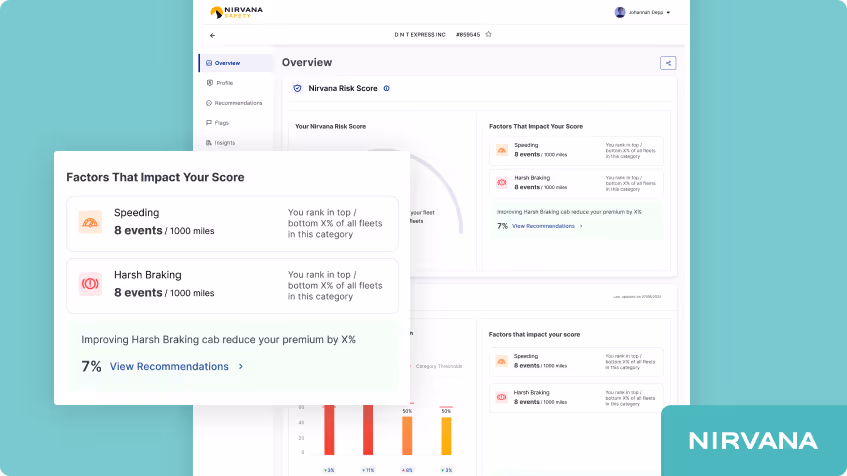
Raw data can be difficult to understand. The Nirvana Safety Platform helps agency partners analyze customer and prospect data to determine how telematics can reduce risk and insurance costs. By combining telematics and FMCSA data, insureds gain full visibility into vehicle and driver performance. This allows carriers to reward top drivers and coach those who need improvement using clear, actionable insights.
Nirvana looks for the top 40% of fleets from a driving behavior standpoint. Our scoring model is built on 3 billion miles of data and 10,000 crashes. Fleets above the threshold may qualify for coverage, while others can be monitored until performance improves.
To decrease risk, the platform provides safety recommendations to help carriers prioritize initiatives. Holding drivers accountable leads to fewer losses and lower premiums. Based on this data, Nirvana applies discounts ranging from 5% to 20%.
Which brings us back to Company A and Company B.
Nirvana underwrites like a traditional carrier — starting with BASIC scores — then layers in telematics to fully understand true fleet risk. While both companies showed some questionable activity, telematics revealed that Company A demonstrated far better driver behavior.
Company A became an ideal client and received a 15% premium discount. Company B was declined for coverage.
The moral of the story: Good driver behavior has real value. Nirvana recognizes that. To learn more, contact Nirvana.


.avif)